
Codemode-style gateways solved a real problem. Instead of dumping every tool’s full schema into a model’s context up front, the model gets one tool — search, then call — and the catalog stays server-side until something actually needs it. That single change is why a gateway wiring up thousands of tools across a dozen services can still show a model a context in the low thousands of tokens instead of hundreds of thousands.
It also only solves one side of the problem. A tool call still returns whatever the underlying API sends back — every field, every nested object, every row — and none of that goes through the same discipline the input side just got. The response is the part of context that grows every single turn, every single tool call, for the entire length of a session. If the input side is the cost of showing up, the output side is the cost of staying.
This post is a measured look at both sides on the same task, using the most visible and most credible example of a codemode gateway available today — Executor — as the reference point. Not because it’s uniquely behind. Every codemode-style gateway I’ve checked has the same gap. Executor is simply the clearest, best-documented example of the pattern, with its own published chart making the input-side claim directly comparable.
The MCP ecosystem is heading toward baking codemode-style discovery into the spec itself. That’s the right direction. It’s also exactly the moment to point at the half of the problem that isn’t solved yet, before “codemode” quietly becomes shorthand for “context efficiency, done.”
For the conceptual framing — why input-only compression compounds across turns — see Both Sides: Why Input Compression Alone Isn’t Enough. This post is the benchmark.
The task
Executor’s own homepage shows a chart: a catalog of 1,640 tools across GitHub, Stripe, Jira, Sentry, Linear, Gmail, Notion, and Slack costs roughly 278,800 tokens if dumped as flat tool definitions. Their single execute tool, with search-then-call discovery, costs roughly 1,044 tokens for the same catalog. That’s their own showcase example, and it’s a real, legitimate result on the input side.
To make a fair comparison, we used their own pattern on their own listed integration — GitHub — with a task shaped exactly like their published workflow:
Find all open PRs authored by a specific user in a specific repo with more than 3 review comments. Return the title and comment count for each.
This is deliberately mundane. It’s the kind of task a codemode gateway is built for, and it’s the kind of task where a tool’s response is naturally verbose — a GitHub pull request object carries dozens of fields per item, most of which nothing in this task needs.
Both arms ran against the same repository, the same model, the same fixed output length, and the same system prompt. The OpenBench fixture in the repo applies the author and review-comment filter above; Layer 2 numbers below were measured on the open PR list for the same repo (pulls.list / projected execute) — same endpoint and payload driver, not the exact filter logic. Full harness and methodology are public — the point of this exercise falls apart if the numbers aren’t independently checkable.
Layer 1: tool definitions
This is the layer codemode gateways were built to solve, and it’s the layer where the comparison should be closest.
| Arm | Tokens |
|---|---|
| Executor (published homepage chart) | 1,044 |
ClawQL search + execute | 394 |
| Executor, live install, execute-only | 115 |
The fair, apples-to-apples number against Executor’s own published chart is 394 versus 1,044 — ClawQL comes in smaller. But the more precise number, measured against a live Executor install rather than the marketing page, is 115. That’s smaller than ClawQL’s 394.
This needs to be said plainly rather than buried: on this specific install, Executor’s actual tool-definition overhead beats ours. The published homepage number appears to reflect a more prose-heavy schema description than what a live install actually ships. Both numbers are real; they’re measuring slightly different things, and the honest comparison depends on which one you’re looking at.
The reason this matters for the rest of the post: Layer 1 is close to solved, by both systems, and neither side should claim a decisive win here. What follows is not about who has the smaller tool description.
Layer 2: what happens after the tool runs
Same repository — vercel/next.js, 30 open pull requests, tokenized with cl100k_base. Layer 2 isolates response size on the list call: Executor live CLI pulls.list vs ClawQL live execute with field projection (title, number). The fixture spec in the repo adds author and review-comment filtering; these numbers measure payload verbosity on the PR list itself.
| Arm | Source | Tokens |
|---|---|---|
| Executor | Live CLI, pulls.list | 143,466 |
| ClawQL | Live execute with a field projection (title, number) | 907 |
That’s a 158× difference on the tool result alone. The Executor number matches the size of an unmodified GitHub REST response for the same query — confirmation that the full JSON payload passes through untouched. ClawQL’s execute call accepts a projection specifying exactly which fields the task needs; the response is shaped to that projection before it enters context.
This is the layer no codemode gateway currently addresses. Executor’s own roadmap lists a “trace every call” feature as coming soon — that’s an audit and observability feature, logging what happened, not a mechanism for shaping what a tool actually returns. As far as we’ve found, nothing in the current codemode ecosystem does response-side field selection at the gateway layer.
Combined, and why it compounds
Put both layers together and the picture shifts from “roughly comparable” to something else entirely.
| System | Layer 1 | Layer 2 | Combined | vs. naive tool dump |
|---|---|---|---|---|
| All tools dumped raw | 278,800 | 143,466 | 422,266 | 1× |
| Executor | 1,044 | 143,466 | 144,510 | ~2.9× |
| ClawQL | 394 | 907 | 1,301 | ~325× |
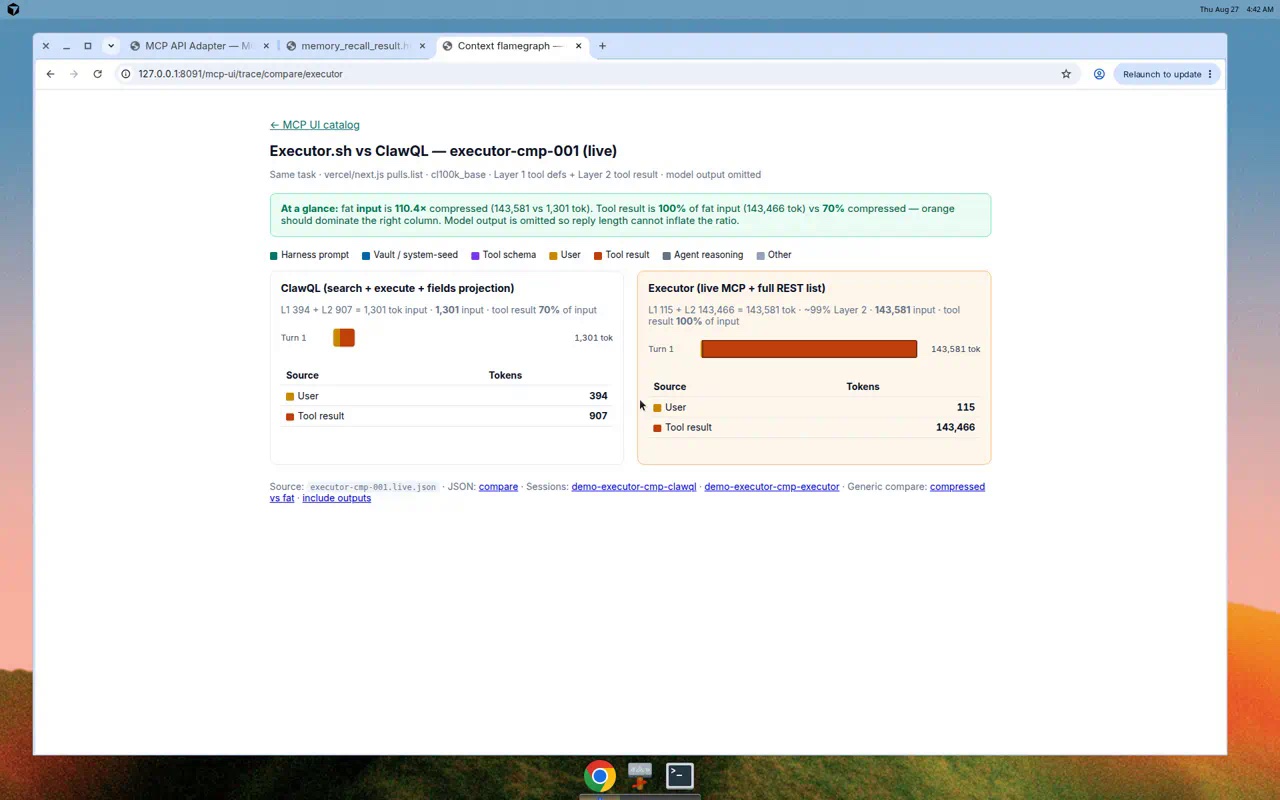
Screenshot from local mcp-api-adapter (executor-cmp-001 live run). Fat input is 110× compressed (143,581 vs 1,301 tok); tool result is 100% of Executor’s input vs 70% of ClawQL’s. Interactive flamegraph UI ships with ClawQL PR #988; raw JSON is executor-cmp-001.live.json.
Executor’s own effective compression against a naive tool dump is real — about 2.9×. Almost none of that comes from the tool result; the tool result is the same size whether or not a codemode gateway sits in front of it. On this task, Layer 2 accounts for roughly 99% of Executor’s total token bill. The gateway compressed the one part of the problem that’s paid once per session and left untouched the part that’s paid every single turn.
That’s the part worth sitting with. A tool definition is loaded once and, in most implementations, cached for the rest of the session. A tool result is fresh content on every call. Compressing the thing you pay for once matters. Compressing the thing you pay for repeatedly matters more, and it matters more the longer a session runs.
We measured that directly, running five sequential PR-list calls rather than one:
| Calls | Executor | ClawQL | Ratio |
|---|---|---|---|
| 1 | 143,581 | 1,301 | 110× |
| 3 | 431,739 | 3,115 | 139× |
| 5 | 729,915 | 4,929 | 148× |
The ratio climbs with every additional call, approaching the pure Layer 2 ratio (158×) as the fixed one-time cost of Layer 1 gets amortized down to nothing. This isn’t a quirk of one repository. We reran the same five-call sequence across a mix of surfaces — pull requests, issues, commits, events, releases, several of which return leaner payloads than a PR list — and got a smaller but still substantial 66× at five calls, with individual Layer 2 ratios averaging around 72× across that mix. The exact number depends on how verbose a given session’s tool responses happen to be. The direction doesn’t change: more calls, larger gap, every time we tested it.
This is also where prompt caching quietly stops helping. Caching rewards a stable prefix — the same tool definitions and system instructions across turns, discounted on repeat. Tool results are the dynamic part; they don’t get to reuse each other’s cache regardless of which gateway sits in front of them. When 99% of a system’s token bill is the uncacheable part, caching has almost nothing to work with. The problem isn’t that Executor’s cache hit rate is bad. It’s that the overwhelming majority of its cost was never eligible for caching in the first place, because it was never compressed.
The honest caveats
A few things worth stating directly, because a comparison that leaves these implicit isn’t one you should trust.
This is one task family. GitHub pull request, issue, and commit listing tends to return verbose objects. A task against a leaner API surface will show a smaller Layer 2 gap — our own mixed-surface run landed at 66× rather than 148× for exactly this reason. The mechanism holds; the exact multiplier is workload-dependent, and anyone evaluating this for their own use case should measure it against their own tool responses rather than taking either number as universal.
This is one gateway. Executor was chosen because it’s the most visible, most credible example of the pattern, with a homepage chart that made a fair Layer 1 comparison possible without guessing at their numbers. It is not the only codemode-style gateway, and this isn’t a claim that it’s uniquely behind — every implementation we’ve looked at treats the tool result as pass-through.
394 does not beat 115. ClawQL’s search-and-execute overhead is smaller than Executor’s published marketing number, but not smaller than what a live Executor install actually ships. That inconvenient number stays in this post because the point isn’t “ClawQL wins Layer 1.” The point is Layer 2.
Live numbers only. Every Layer 2 figure above came from a real GitHub repository, a real Executor CLI call, and a real ClawQL execute call — not a fixture or an estimate. The harness and the raw run data are public specifically so this can be checked rather than taken on faith.
What this means for anyone building a codemode gateway
If you’re building or maintaining a tool-calling gateway that already does search-then-call discovery, you’ve solved the harder engineering problem. Response-side field projection is a much smaller addition on top of infrastructure you already have — you’re not redesigning discovery, you’re adding a projection parameter to the call step and applying it before the response leaves your server.
The mechanism doesn’t need to be GraphQL-shaped specifically. Any way for a caller to say “give me these fields, not all of them” before the response crosses back into a model’s context does the job. What matters is that the response gets shaped at all, rather than passed through whole because the input side already got the attention.
The MCP ecosystem’s own roadmap is moving toward standardizing progressive tool discovery — the input side of this exact problem. That’s a good thing, and it’s also the reason to raise this now rather than later: if codemode-style discovery becomes table stakes at the spec level, response shaping should be part of that conversation too, not a gap that gets carried forward unaddressed because the input side got fixed first and everyone moved on.
The harness, task definitions, and raw results behind every number in this post are public — including the screenshot above and the side-by-side ratios it shows (110× with live Layer 1, 111× with published homepage Layer 1). Check the JSON rather than taking our word for it. If your numbers come out different on your own tool responses, that’s useful information — for you and for this argument. Either way, the fix is the same: don’t stop at the tool definition. Compress what comes back too.
Methodology and reproduce steps: executor-comparison README (ClawQL PR #988; docs page at docs.clawql.com/benchmarks/executor-comparison ships with that merge)
Raw run data: executor-cmp-001.live.json · multi-turn: executor-cmp-002b.uniform-pulls.live.json
Interactive flamegraph (/mcp-ui/trace/compare/executor) requires a public mcp-api-adapter host — not yet deployed; use local adapter per README until then
Related: Anything to MCP to Anything · The Twelve Layers of LLM Cost · Both Sides: Why Input Compression Alone Isn’t Enough